


PyAGH is a Python package developed for calculating relationship matrix using pedigree, genotype or microbiology data as well as processing, analysis and visualization for data. PyAGH provides fast and concise methods for calculating Amatrix (based on pedigree), Gmatrix (based on genotype), Mmatrix(based on OTU) and Hmatrix (based on pedigree and genotype) used in breeding. PyAGH supports high marker density typing data, large pedigree data, microbiome data, additive, dominant and epistatic effects relationship matrix, relationship matrix construction across population. With the obtained relationship matrix, you can use PyAGH for fast visualization, including PCA analysis, Cluster analysis and drawing Heatmaps.
To make it easier to use pedigree information, PyAGH also provides targeted tools for specific needs, such as detecting pedigree errors, selection individuals, pedigree visualization, sorting pedigree, calculating inbreeding coefficients and calculating relationship coefficients . The latest stable release of the software can be installed conveniently via pip .
The target audience of PyAGH includes:
- Students and researchers in the field of breeding and genetics, particularly those who want to perform genomic prediction.
- Government, enterprises, or other entities who expect efficient processing of pedigree and genomic information.
- Provide a variety of methods for calculating kinship matrix including combined reference population.
- Fast and support tens of millions of genotypes.
Currently, PyAGH mainly provides the following methods:
- Pedigree sorting: Provides methods to quickly obtain the correct pedigree in chronological order of birth clean multiple types of data error.
- Pedigree selection: Provides methods to select pedigree based on specific individuals and generations.
- Calculation of coefficients: Provides methods to easily obtain the inbreeding and relationship coefficients of specific individuals.
- Kinship matrix: Provides different methods to calculating Amatix, Gmatrix and Hmatrix.
- Visualization: Provides methods to display results.
It is recommended to use Python 3.9
PyAGHcan be installed by using pip install.
pip install PyAGHloadEgPed() and loadEgGeno() functions can load the example data.
import PyAGH
ped = PyAGH.loadEgPed()
genofile = PyAGH.loadEgGeno() #is a filename
ped| index | id | sire | dam |
|---|---|---|---|
| 0 | 9 | 1 | 2 |
| 1 | 10 | 3 | 4 |
| 2 | 11 | 5 | 6 |
| 3 | 12 | 7 | 8 |
| 4 | 13 | 9 | 10 |
| 5 | 14 | 11 | 12 |
| 6 | 15 | 11 | 4 |
| 7 | 16 | 13 | 15 |
| 8 | 17 | 13 | 14 |
sortPed() is a function that can sort the pedigree according to the correct birth date of individuals and check for various errors in the pedigree.
ped_sorted = PyAGH.sortPed(ped)
ped_sorted| index | id | sire | dam |
|---|---|---|---|
| 0 | 1 | 0 | 0 |
| 1 | 3 | 0 | 0 |
| 2 | 5 | 0 | 0 |
| 3 | 7 | 0 | 0 |
| 4 | 2 | 0 | 0 |
| 5 | 4 | 0 | 0 |
| 6 | 6 | 0 | 0 |
| 7 | 8 | 0 | 0 |
| 8 | 9 | 1 | 2 |
| 9 | 10 | 3 | 4 |
| 10 | 11 | 5 | 6 |
| 11 | 12 | 7 | 8 |
| 12 | 15 | 11 | 4 |
| 13 | 13 | 9 | 10 |
| 14 | 14 | 11 | 12 |
| 15 | 16 | 13 | 15 |
| 16 | 17 | 13 | 14 |
selectPed() function can select pedigree based on specific individuals and generations.
ped_selected = PyAGH.selectPed(data=ped,id=['9','10'],generation=3)
ped_selected| index | id | sire | dam |
|---|---|---|---|
| 0 | 1 | 0 | 0 |
| 1 | 3 | 0 | 0 |
| 2 | 2 | 0 | 0 |
| 3 | 4 | 0 | 0 |
| 4 | 9 | 1 | 2 |
| 5 | 10 | 3 | 4 |
makeA(), makeG() and makeH() functions can calculate the kinship matrix using various methods based on pedigree , genotype and both together, respectively.
A = PyAGH.makeA(ped_sorted)
G = PyAGH.makeG(File=genofile,method=1,File_list=False)
G_inter = PyAGH.makeG_inter(geno,method="dd")
M = PyAGH.makeM(OTU)
H = PyAGH.makeH(G,A,w=0.05)
####A,G and H are lists with 2 elements. The first one is kinship matrix in numpy.ndarray type and the other one is id labels in pandas.Series type. coef_inbreeding = PyAGH.coefInbreeding(A)
coef_inbreeding| index | ID | F |
|---|---|---|
| 0 | 1 | 0.0000 |
| 1 | 3 | 0.0000 |
| 2 | 5 | 0.0000 |
| 3 | 7 | 0.0000 |
| 5 | 4 | 0.0000 |
| 11 | 12 | -0.0000 |
| ... | ... | ... |
| 12 | 15 | -0.0000 |
| 13 | 13 | -0.0000 |
| 14 | 14 | -0.0000 |
| 15 | 16 | 0.0625 |
| 16 | 17 | -0.0000 |
coef_kinship = PyAGH.coefKinship(A)
coef_kinship| ID1 | ID2 | r | |
|---|---|---|---|
| 0 | 1 | 1 | 1.000000 |
| 1 | 1 | 3 | 0.000000 |
| 2 | 1 | 5 | 0.000000 |
| 3 | 1 | 7 | 0.000000 |
| 4 | 1 | 2 | 0.000000 |
| ... | ... | ... | ... |
| 148 | 14 | 16 | 0.121268 |
| 149 | 14 | 17 | 0.500000 |
| 150 | 16 | 16 | 1.000000 |
| 151 | 16 | 17 | 0.333486 |
| 152 | 17 | 17 | 1.000000 |
153 rows × 3 columns
cluster_example = PyAGH.cluster(A)
plt.savefig('cluster_example.png', facecolor='w',dpi=300)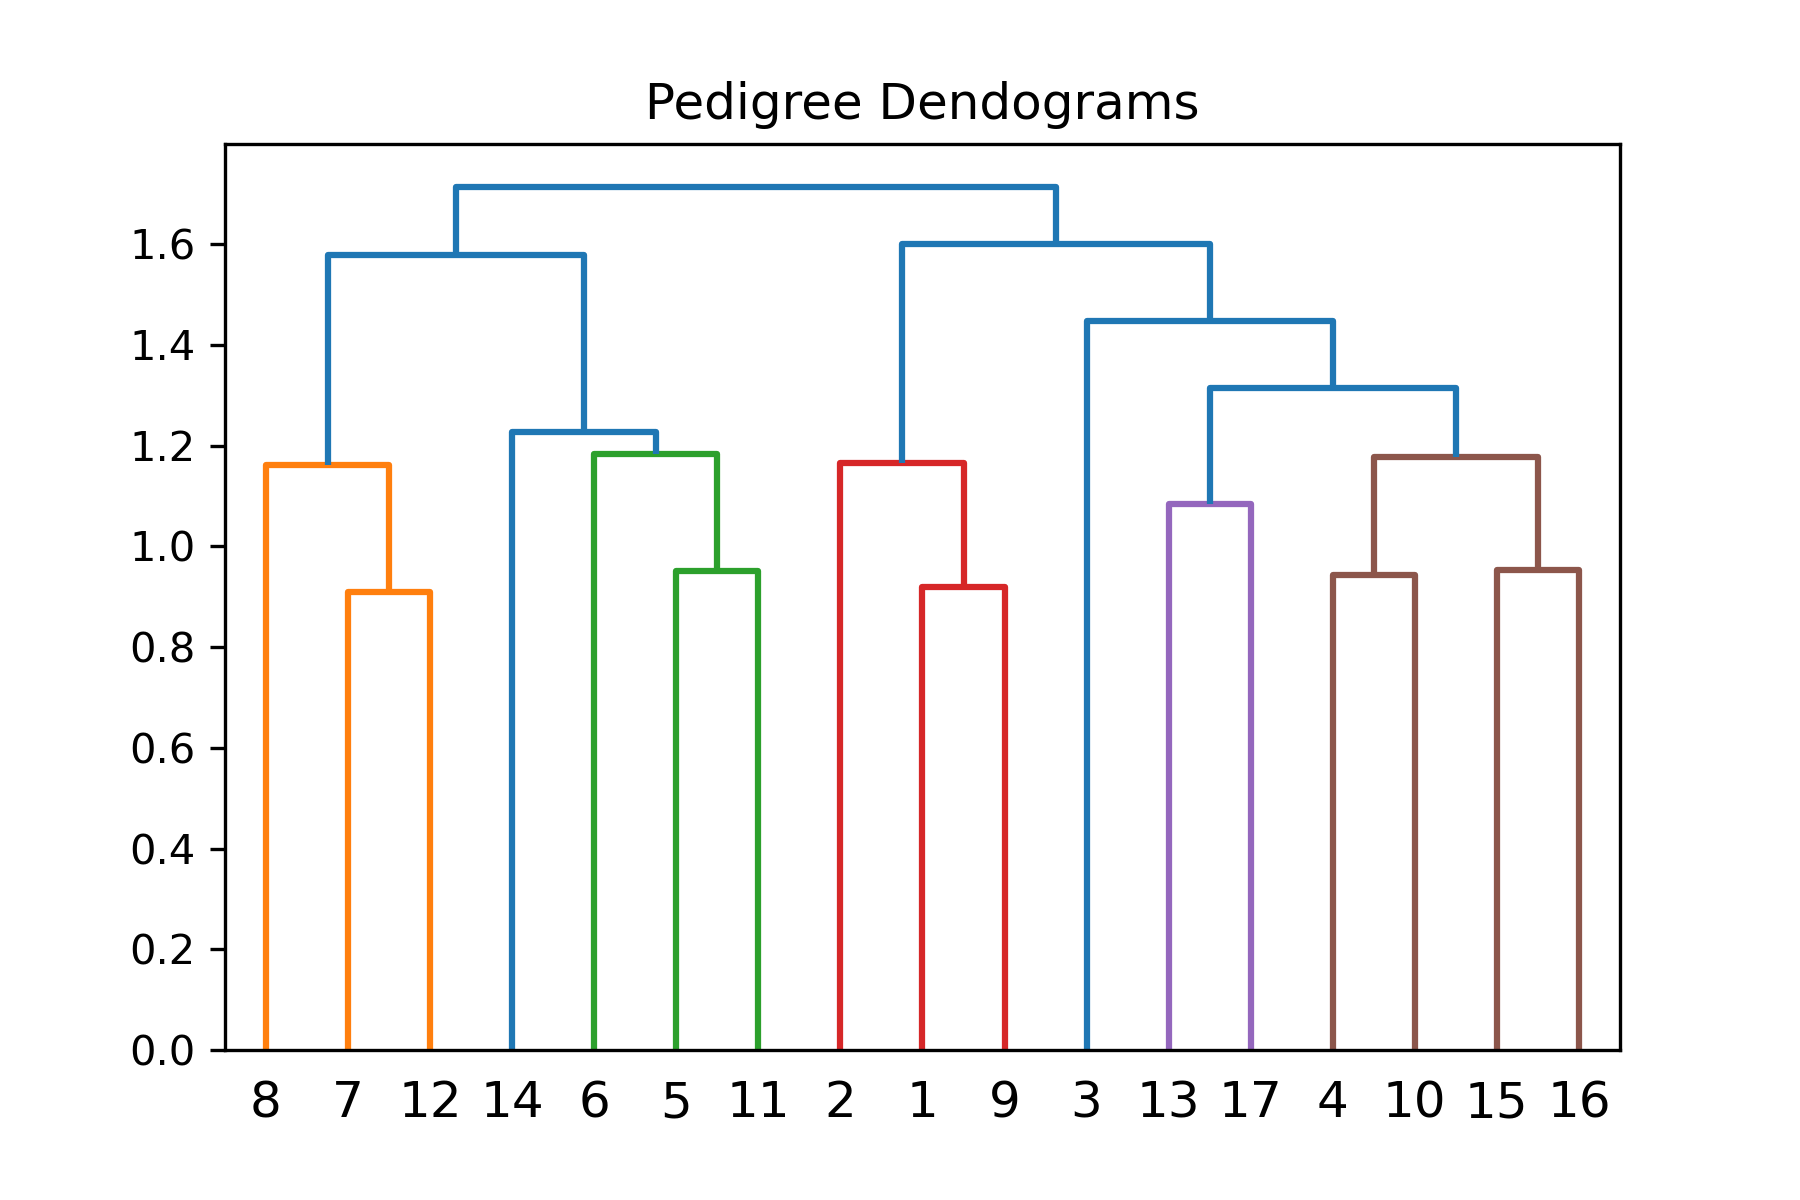
group=['1','1','1','1','1','1','1','2','2','2','2','2','2','2','2','2','2']
pca_example = PyAGH.pca(A,group=group)
pca_example.savefig('pca_example.png', facecolor='w',dpi=300)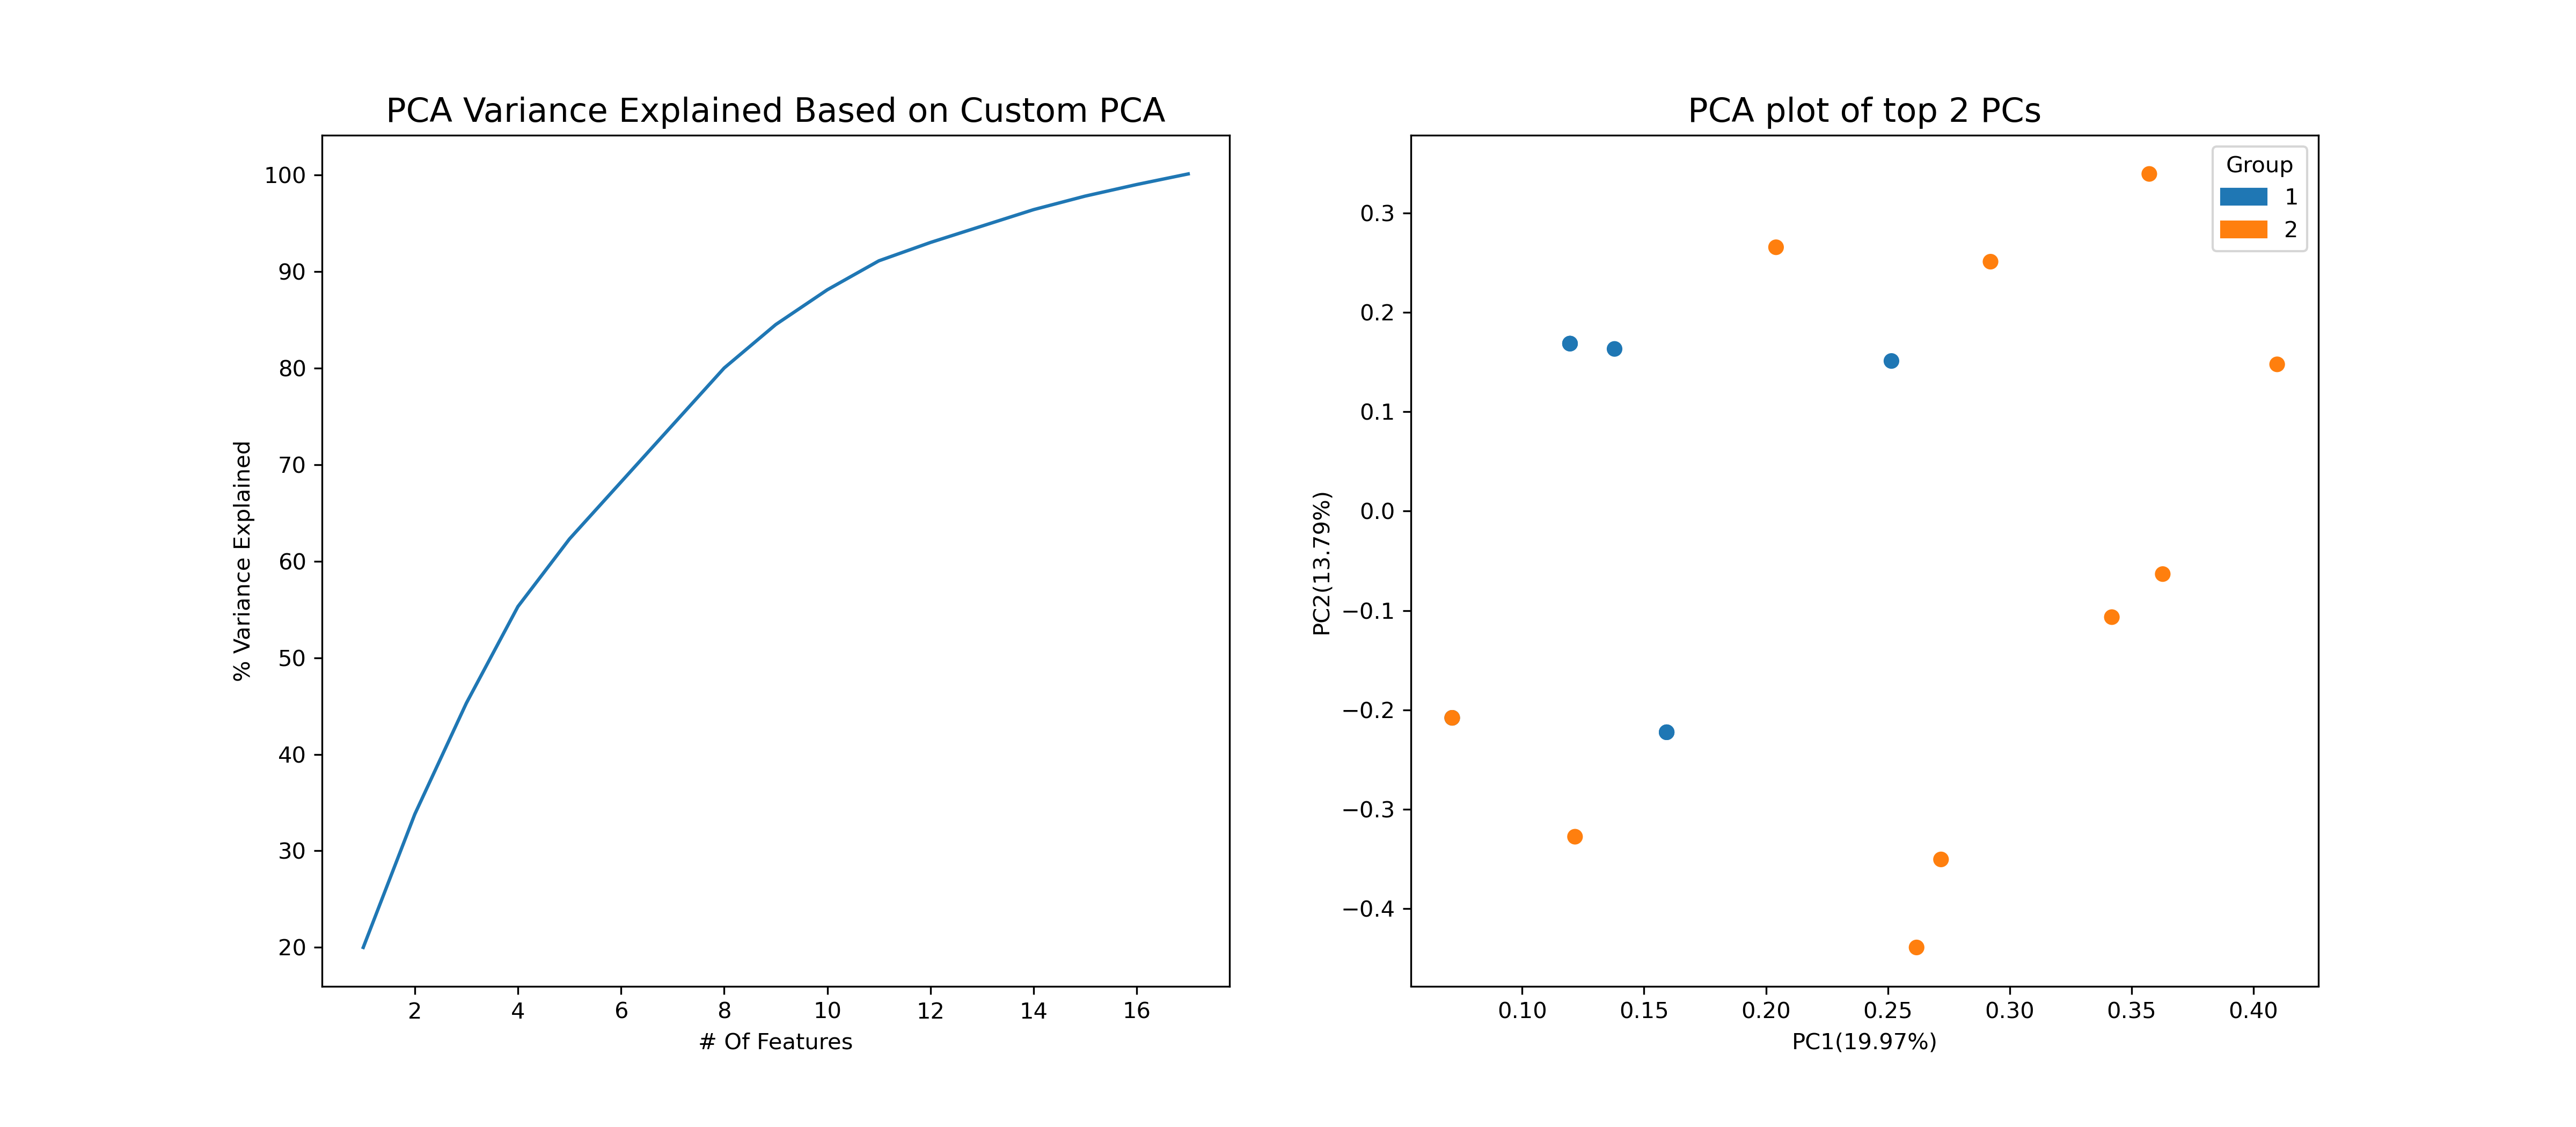
heatmap_example = PyAGH.heat(A)
plt.savefig('heatmap_example.png', facecolor='w',dpi=300)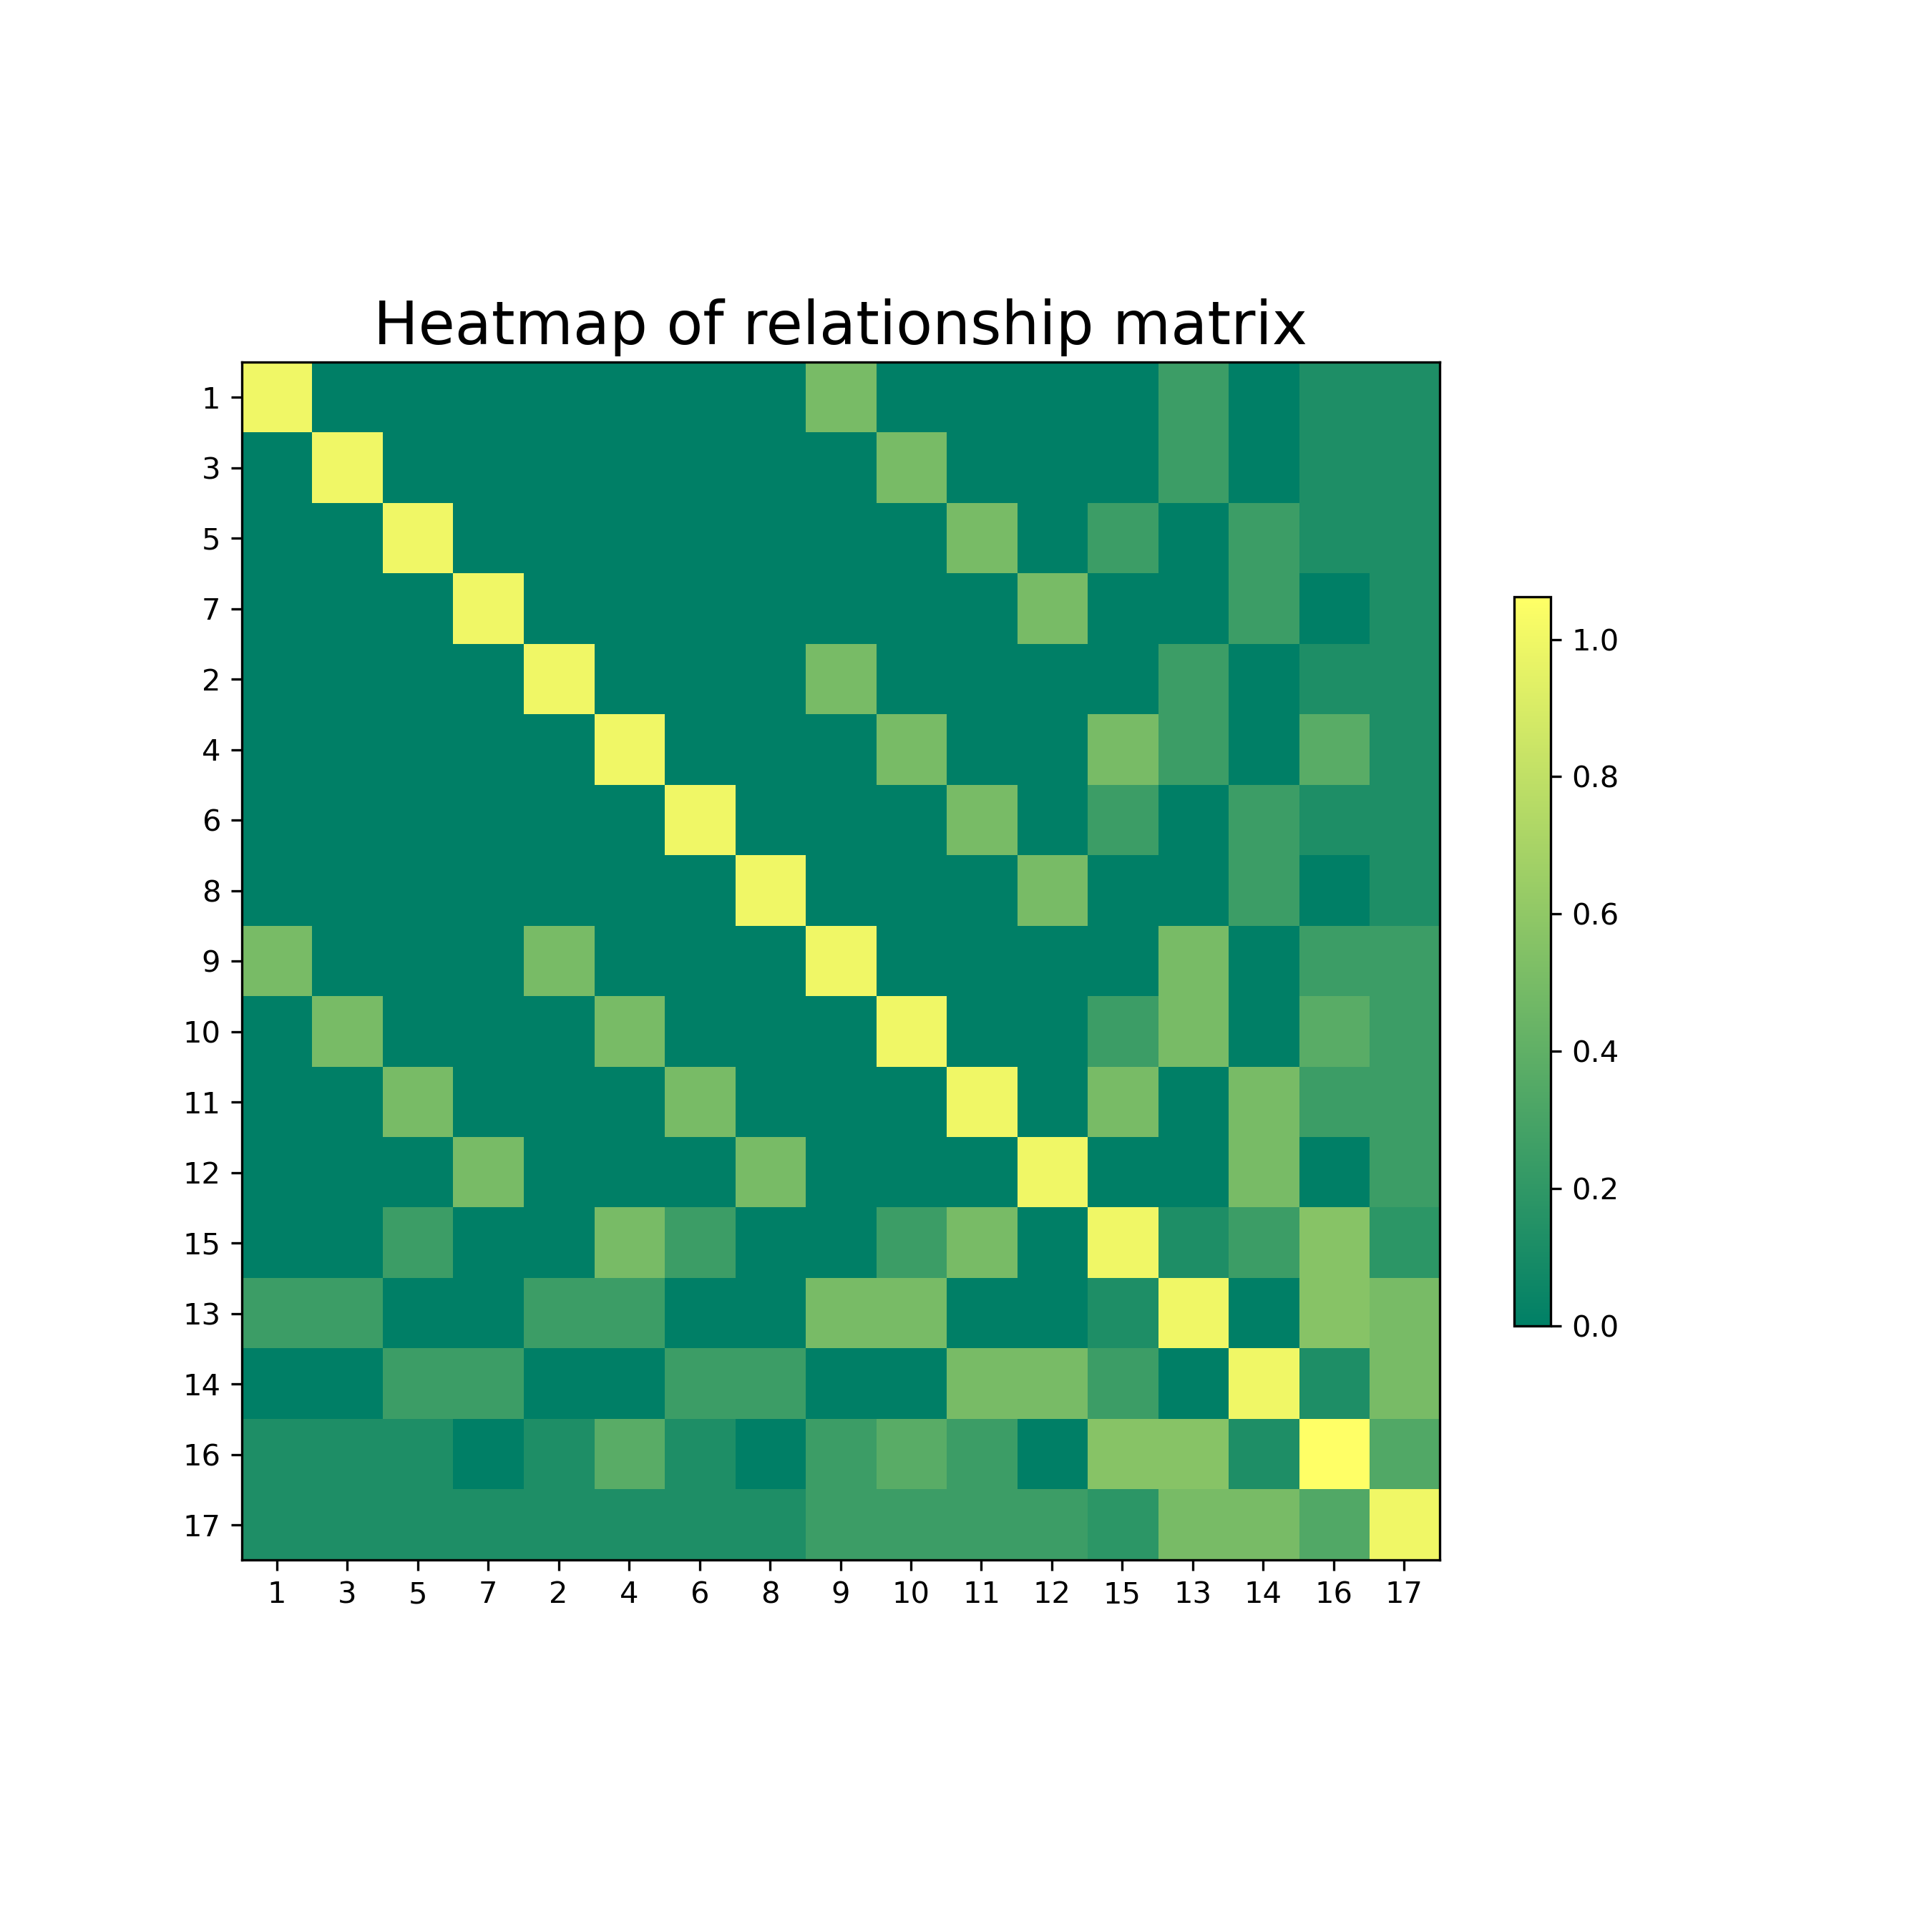
import graphviz
ped_selected = PyAGH.selectPed(data=ped,id=['17'],generation=3)
p = PyAGH.gragh(ped_selected)
graphviz.Source(p)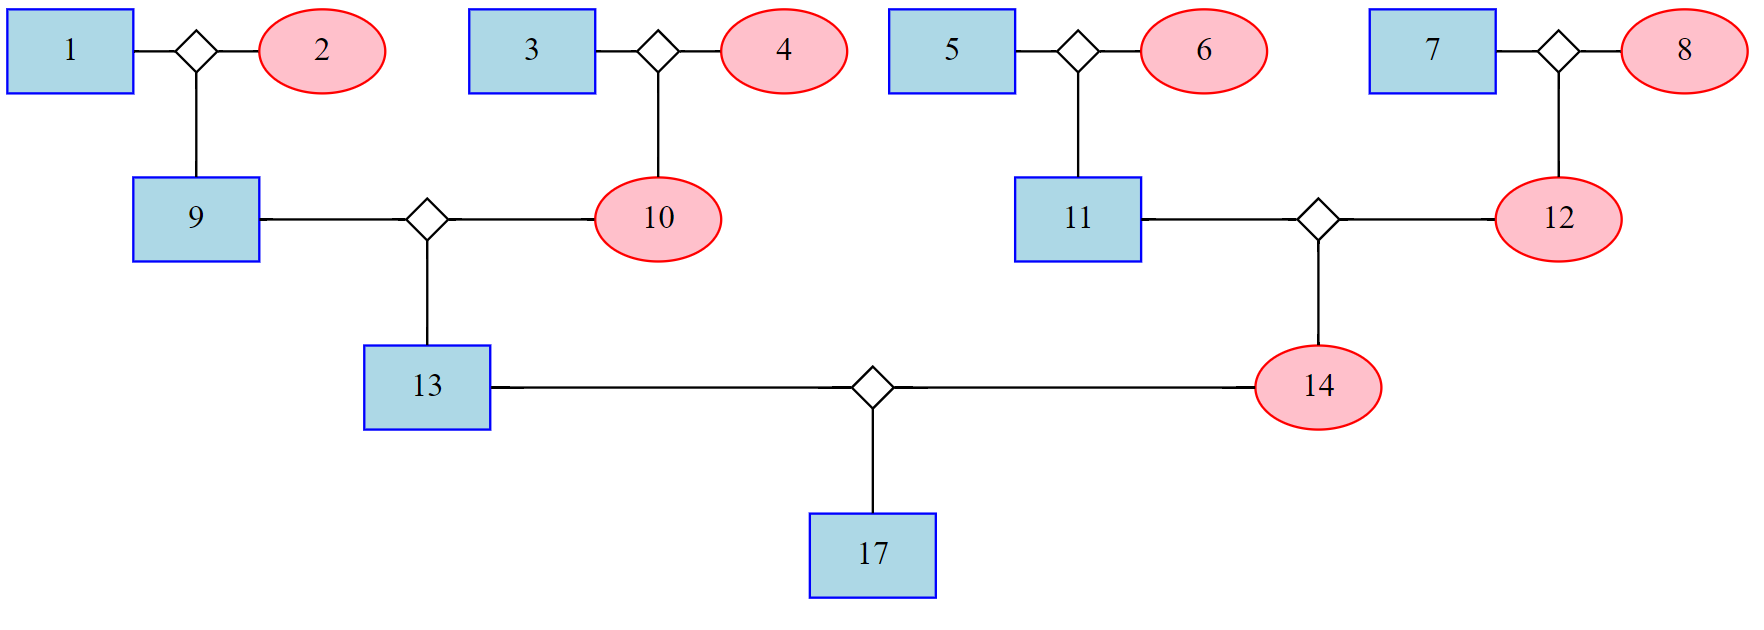
PyAGH is MIT licensed.