![]()
![]()
The Python companion package for ModernDive: Statistical Inference via Data Science — a faithful port of the R moderndive and infer packages to a modern Python data-science stack (polars, plotly, plotnine, statsmodels).
📖 Documentation (with runnable examples): https://moderndive.readthedocs.io
It is intentionally pure-Python (no compiled extensions) so it installs under Pyodide via micropip for in-browser execution.
pip install moderndive          # from PyPI (once published)
# or, from source:
pip install git+https://github.com/moderndive/moderndive-python- A tidy simulation-inference grammar mirroring R
infer:specify → hypothesize → generate → calculate, plusfit()for multiple regression,observe(), andassume()(theoretical t/z/F/Chisq).specify()is also available as a DataFrame method, so you can writedf.specify(...)just like R’sdf %>% specify(...).calculate(stat=...)takes the full infer vocabulary or any custom callable test statistic. Summaries viaget_p_value/get_confidence_interval(percentile, SE, bias-corrected); British-spelling and short aliases included. - Dual-engine plots:
visualize/shade_p_value/shade_confidence_interval(and every plot helper) takeengine="plotly"(default, interactive) orengine="plotnine"— same code, your choice of output. - Theory-based wrapper tests:
t_test,prop_test,chisq_test,t_stat,chisq_stat, plus themoderndive.theorymodule. - Regression & summary helpers mirroring R
moderndive:get_regression_table,get_regression_points,get_regression_summaries,get_correlation,pop_sd,tidy_summary,count_missing(built onstatsmodelswhere relevant, returningpolarsframes), plus the model plotsgg_parallel_slopes/geom_parallel_slopesandgg_categorical_model/geom_categorical_model, andpairplot(theGGally::ggpairsanalog). - Sampling:
rep_slice_sample/rep_sample_nfor sampling-distribution activities. - 58 datasets:
load_*()loaders returningpolarsDataFrames (themoderndive/infer,nycflights23,gapminder, ISLR2, and FiveThirtyEight datasets used in the book).
Are tracks more likely to be popular in metal than in deep house? Compute the observed difference in “popular” rates, then permute the genre labels 1000 times to build a null distribution and read off a p-value.
import moderndive as md
from moderndive import get_p_value, visualize, shade_p_value

spotify = md.load_spotify_metal_deephouse()

# Observed difference in popularity rates (metal − deep house)
obs = (
    spotify
    .specify(formula="popular_or_not ~ track_genre", success="popular")
    .calculate(stat="diff in props", order=("metal", "deep-house"))
)
obs
ObservedStatistic(stat='diff in props', value=0.034)
# Permutation null distribution + p-value
null = (
    spotify
    .specify(formula="popular_or_not ~ track_genre", success="popular")
    .hypothesize(null="independence")
    .generate(reps=1000, type="permute", seed=76)
    .calculate(stat="diff in props", order=("metal", "deep-house"))
)
print(get_p_value(null, obs_stat=obs, direction="right"))
shape: (1, 1)
┌─────────┐
│ p_value │
│ --- │
│ f64 │
╞═════════╡
│ 0.075 │
└─────────┘
# Visualize — interactive plotly by default; engine="plotnine" for ggplot-style
visualize(null) + shade_p_value(obs_stat=obs, direction="right")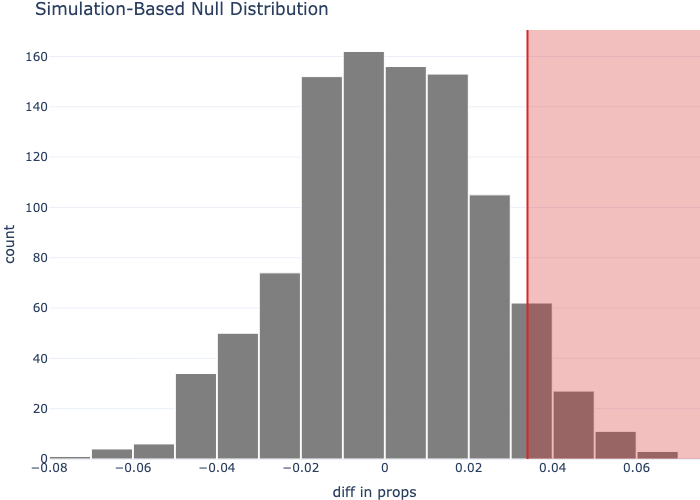
This repo uses uv.
uv sync --extra dev          # create the environment
make test                    # run the test suite (enforces 100% coverage)
make readme                  # re-render README.md from README.qmd (needs Quarto)
make build-data              # rebuild the bundled Parquet datasets (needs R; see tools/)
make build                   # build the wheel/sdist
The test suite is held at 100% statement coverage (enforced in CI via --cov-fail-under=100). Releases are automated on v* tags — see RELEASING.md.
MIT. The ModernDive book content is licensed CC-BY-NC-SA 4.0; this software package is MIT-licensed.