
visPedigree provides tools for the analysis and visualization of animal and plant pedigrees. Analytical methods cover equivalent complete generations, generation intervals, effective population size, founder and ancestor contributions, partial inbreeding, genetic diversity indices, and relationship matrices (A, D, AA). Core algorithms — ancestry tracing, topological sorting, inbreeding coefficients, and matrix construction — are implemented in C++ (Rcpp/RcppArmadillo) and data.table, scaling to pedigrees with over one million individuals. Pedigree graphs are rendered via igraph; relationship matrices can be visualized as heatmaps. Complex mating systems are supported, including selfing and pedigrees in which the same individual can appear as both sire and dam.
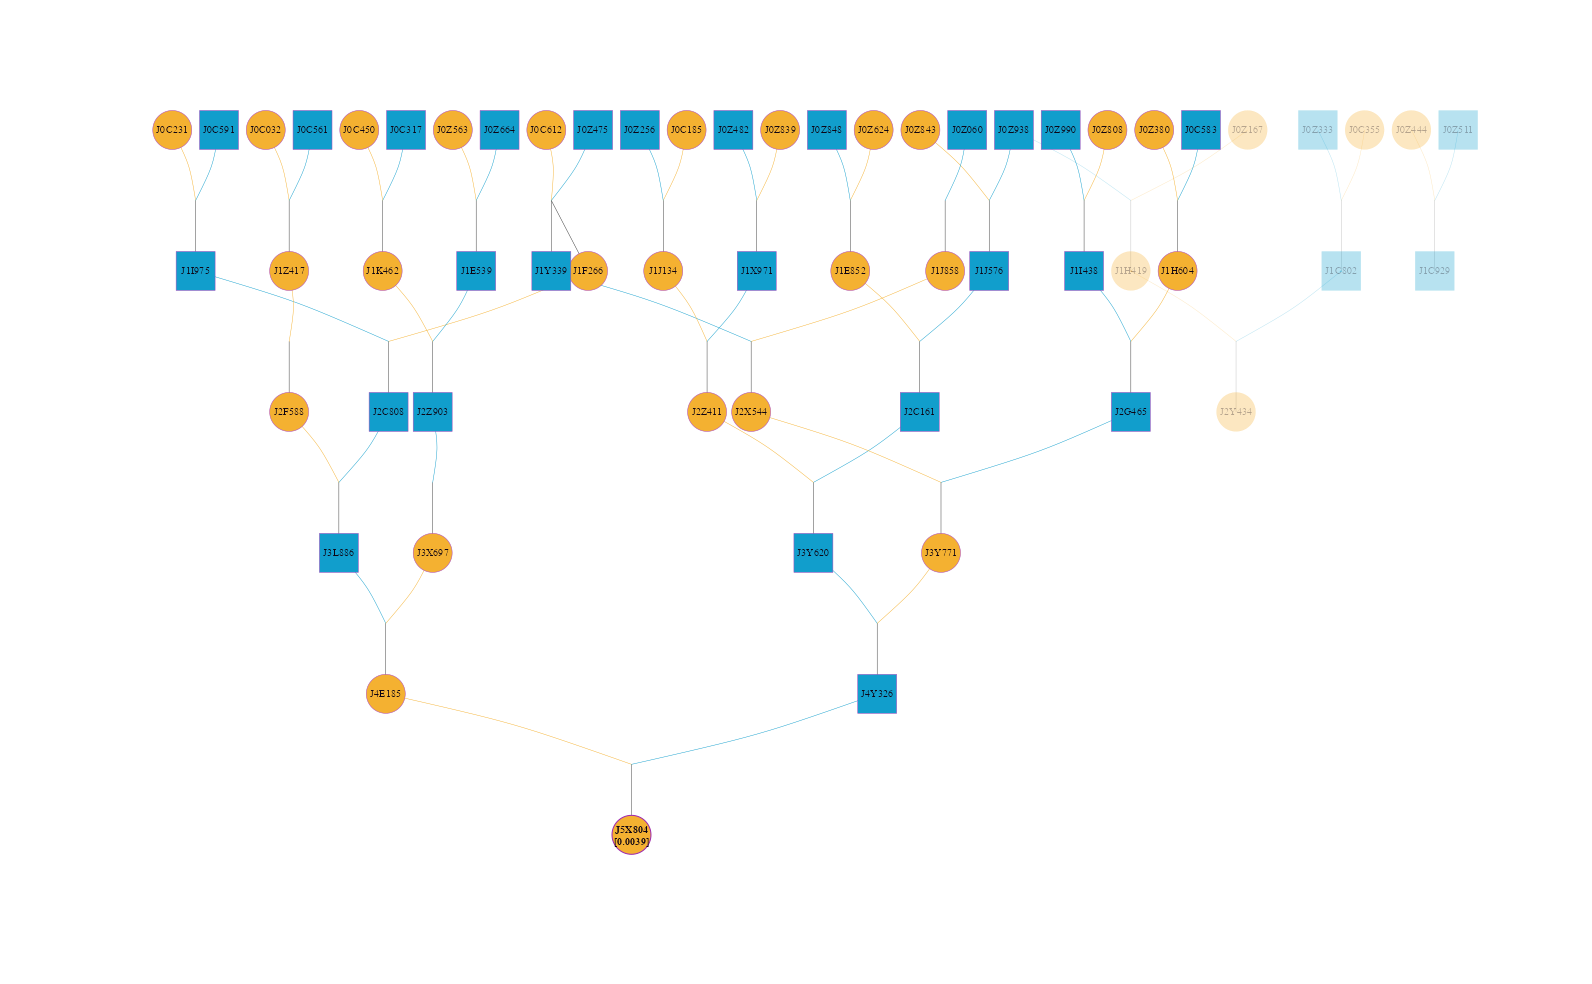
- Pedigree Standardization: Standardizes pedigree records, handles selfing and pedigrees in which the same individual can appear as both sire and dam, detects pedigree loops, prepares pedigrees for downstream analysis, and efficiently splits disconnected sub-populations.
- Comprehensive Pedigree Analysis: Computes pedigree summaries, equivalent complete generations, generation intervals, effective population size, founder and ancestor contributions, partial inbreeding, relationship matrices, and inbreeding coefficients.
- High-Throughput Matrix Calculation: Calculates Additive (A), Dominance (D), and Additive-by-Additive (AA) relationship matrices and their inverses.
-
Matrix-Free Relationship Products: Computes
$Ax$ ,$AX$ ,$A^{-1}x$ , and$A^{-1}X$ directly from an ordered pedigree withpedprod(), avoiding construction of the dense additive relationship matrix. -
Advanced Visualization: Renders scalable pedigree graphs via
igraphwith compact representations for large full-sib families, plus heatmap displays for relationship matrices. -
High Performance: Core algorithms — ancestry tracing, topological sorting, inbreeding calculation, and matrix construction — are implemented in C++ (Rcpp/RcppArmadillo) with
data.tablefor tabular operations, scaling to pedigrees with over one million individuals.
install.packages("visPedigree")# install.packages("devtools")
devtools::install_github("luansheng/visPedigree", build_vignettes = TRUE)Recommended reading order:
- How to tidy a pedigree
- Efficient visPedigree Workflows
- Pedigree Visualization in R
- Pedigree Analysis and Genetic Diversity in R
- Pedigree Relationship Matrices and Matrix-Free Products in R
library(visPedigree)

# Example 1: Tidy and visualize a small pedigree
# Use compact = TRUE to condense eligible full-sib groups into a green-grey
# family-summary rectangle labelled FS×N.
cands <- c("Y", "Z1", "Z2")
small_ped |>
  tidyped(cand = cands) |>
  visped(compact = TRUE)

# Example 2: Relationship Matrices (v1.0.0+)
# Compute the additive relationship matrix (A) using high-performance C++ algorithms.
# Use compact = TRUE to accelerate calculation for pedigrees with large full-sib families.
mat_a <- simple_ped |> tidyped() |> pedmat(method = "A", compact = TRUE)
# Visualize the relationship matrix as a heatmap with histograms
vismat(mat_a)

# Apply A to candidate contribution weights without constructing A
tp_simple <- tidyped(simple_ped)
candidate_weights <- c(J5X804 = 0.5, J3Y620 = 0.5)
weighted_relationship <- pedprod(tp_simple, candidate_weights)

# Example 3: Inbreeding & Highlighting
# Calculate inbreeding coefficients (f) and display them on the graph (e.g., "ID (0.05)").
# Specific individuals can be highlighted to track their inheritance paths.
simple_ped |>
  tidyped(inbreed = TRUE) |>
  visped(highlight = "J5X804", trace = "up", showf = TRUE, compact = TRUE)

# Example 4: Pedigree Analysis (v1.4.0+)
# Summarize pedigree structure
tp <- tidyped(big_family_size_ped)
tp |>
  pedstats(timevar="Year")

# Summarize diversity-related indicators
ref_ind <- tp[Gen == max(Gen), Ind]
tp |>
  pediv(reference = ref_ind)

# Example 5: Pedigree Splitting
# Automatically split the pedigree into independent sub-populations (connected groups).
# Each group is returned as a standalone tidyped object for separate analysis.
split_list <- simple_ped |> tidyped() |> splitped()
summary(split_list[[1]])If you use visPedigree in published work, please cite:
Luan S, Kong J, Xia Z, Kang Z, Qiang G, Luo K, Sui J. 2026. visPedigree: a comprehensive R package for tidying, analyzing, and visualizing breeding pedigrees. Bioinformatics Advances. DOI: 10.1093/bioadv/vbag210.