


deglyph loads a PE, ELF, or Mach-O and recovers its functions, including when the binary exports nothing. From there you can read annotated disassembly, walk recursive call graphs, read a heuristic pseudo-C view, and run pattern detectors that recover structure facts (constants, call arguments, CRC loops) without a decompiler. Branch and call targets are clickable, renames and notes persist between sessions, and an optional AI assistant can explain a selected function.
deglyph is built for triage, exploration, and CI review, not for full reverse engineering. It is not a decompiler and not a replacement for Ghidra, IDA, or Binary Ninja. Its analysis is static and heuristic, so it has real blind spots: indirect and virtual calls, jump tables, obfuscated or packed code, heavily optimized stripped C++, unusual ABIs, and anything that only appears at runtime. See Limitations for the full list and Heuristics, Not Proofs for how to read the output.
- Exploration and understanding. Make sense of an unfamiliar PE/ELF/Mach-O: follow an exported wrapper to the real implementation, walk callers and callees, read disassembly with targets resolved to names, and ask the assistant what a function does.
- Defensive review for app developers. Audit your own binary before you ship
it: find hardcoded secrets and magic values, spot CRC/checksum and command-
dispatch routines, see which functions and imports you expose, and diff two
builds of the same library to catch unintended changes.
deglyph scandoes this headless with a SARIF report and a CI exit code for use in a pipeline.
deglyph never executes the binary it analyzes; it only reads and disassembles it. Built on LIEF for container parsing, Capstone for disassembly, and Textual for the interface. Python 3.10+. GPLv3 licensed.
Load any object. PE32, PE32+, ELF, Mach-O, and fat binaries. Format and
architecture are detected from the file; --fmt and --arch override the
detection when a file is mislabeled or you want to read one slice a different way.
Find a function. The tree lists exports, symbols, imports, the entrypoint,
and, for stripped binaries that export nothing, functions recovered by scanning
.text for call targets, named sub_<address>. (A release notepad.exe has no
exports; discovery turns its lone entrypoint into hundreds of navigable functions.)
Functions are grouped into expandable folders by kind and name prefix, and you
type to filter with a subsequence match (encfr finds encode_frame).
Read disassembly. Branch and call targets are resolved against the symbol table and shown by name. Targets inside the image are clickable: click one to jump to it. Move the table cursor and the listing follows.
Follow a wrapper to its implementation. Exported functions are often thin
stubs that validate arguments and jump to the real routine. Press f and deglyph
resolves the chain to the function that does the work.
Walk the call graph. For any function, see the wrapper-to-implementation chain plus recursive caller and callee trees, drawn as an ASCII tree in the terminal (callers are indexed across the whole image in one pass; the walk is cycle-safe and bounded).
Navigate by call graph (c). A focused node view centered on the selected
function: its callers above, callees below, at most seven nodes on screen at once.
Click a node to recenter the graph there; when a group has more, a pager node
cycles through it. This is the way to move through an unfamiliar binary by
following calls rather than scrolling the table.
Recover structure. The analysis view runs three detectors:
- Immediate stores:
mov [buffer + offset], immwrites that initialize a structure or buffer at fixed offsets, exposing magic values, flags, sizes, and header fields. - Call-argument immediates: constant values placed in a register right before
a
call, such as mode selectors, flags, sizes, and command codes handed to a shared routine. - CRC and checksum loops: bit-twiddling loops, with the candidate polynomial and init value, and a name for well-known polynomials (CRC-16/CCITT, MCRF4XX, MODBUS, CRC-32, and others).
These are heuristics that point you at the right instructions. The disassembly view is always one key away to confirm what a detector found.
The detectors run over an architecture-neutral operand walk, so they inspect x86, x86-64, and AArch64 (arm64) targets. The pseudo-C view is still x86-only. On 32-bit ARM, deglyph loads the file, lists functions, resolves wrappers, and disassembles, but the detectors report nothing until that operand walk is added.
Extract the data. Press s for a browsable list of every string in the
binary (ASCII, UTF-8, and UTF-16LE, with address and section): a built-in
strings(1). The analysis view also lists the data a function references:
the strings, lookup tables, and pointer constants it reads, each decoded as text
or a short hex preview. Pull the same string list headless with
deglyph BINARY --strings (add --json to pipe it); --strings-min,
--strings-section, and --strings-all tune the dump.
Search the image. Byte patterns with ?? wildcards, ASCII and UTF-16
strings, and immediate constants referenced anywhere in executable code (useful
for locating a CRC polynomial or a magic value).
Read pseudo-C. A readable, line-by-line C-like view of the selected function:
registers as variables, mov as assignment, compares feeding the following
conditional jump, calls and jumps as name(...) / goto. It is a heuristic reading
of the assembly (x86 only, no type recovery), so keep the disassembly as the source
of truth when a detail matters.
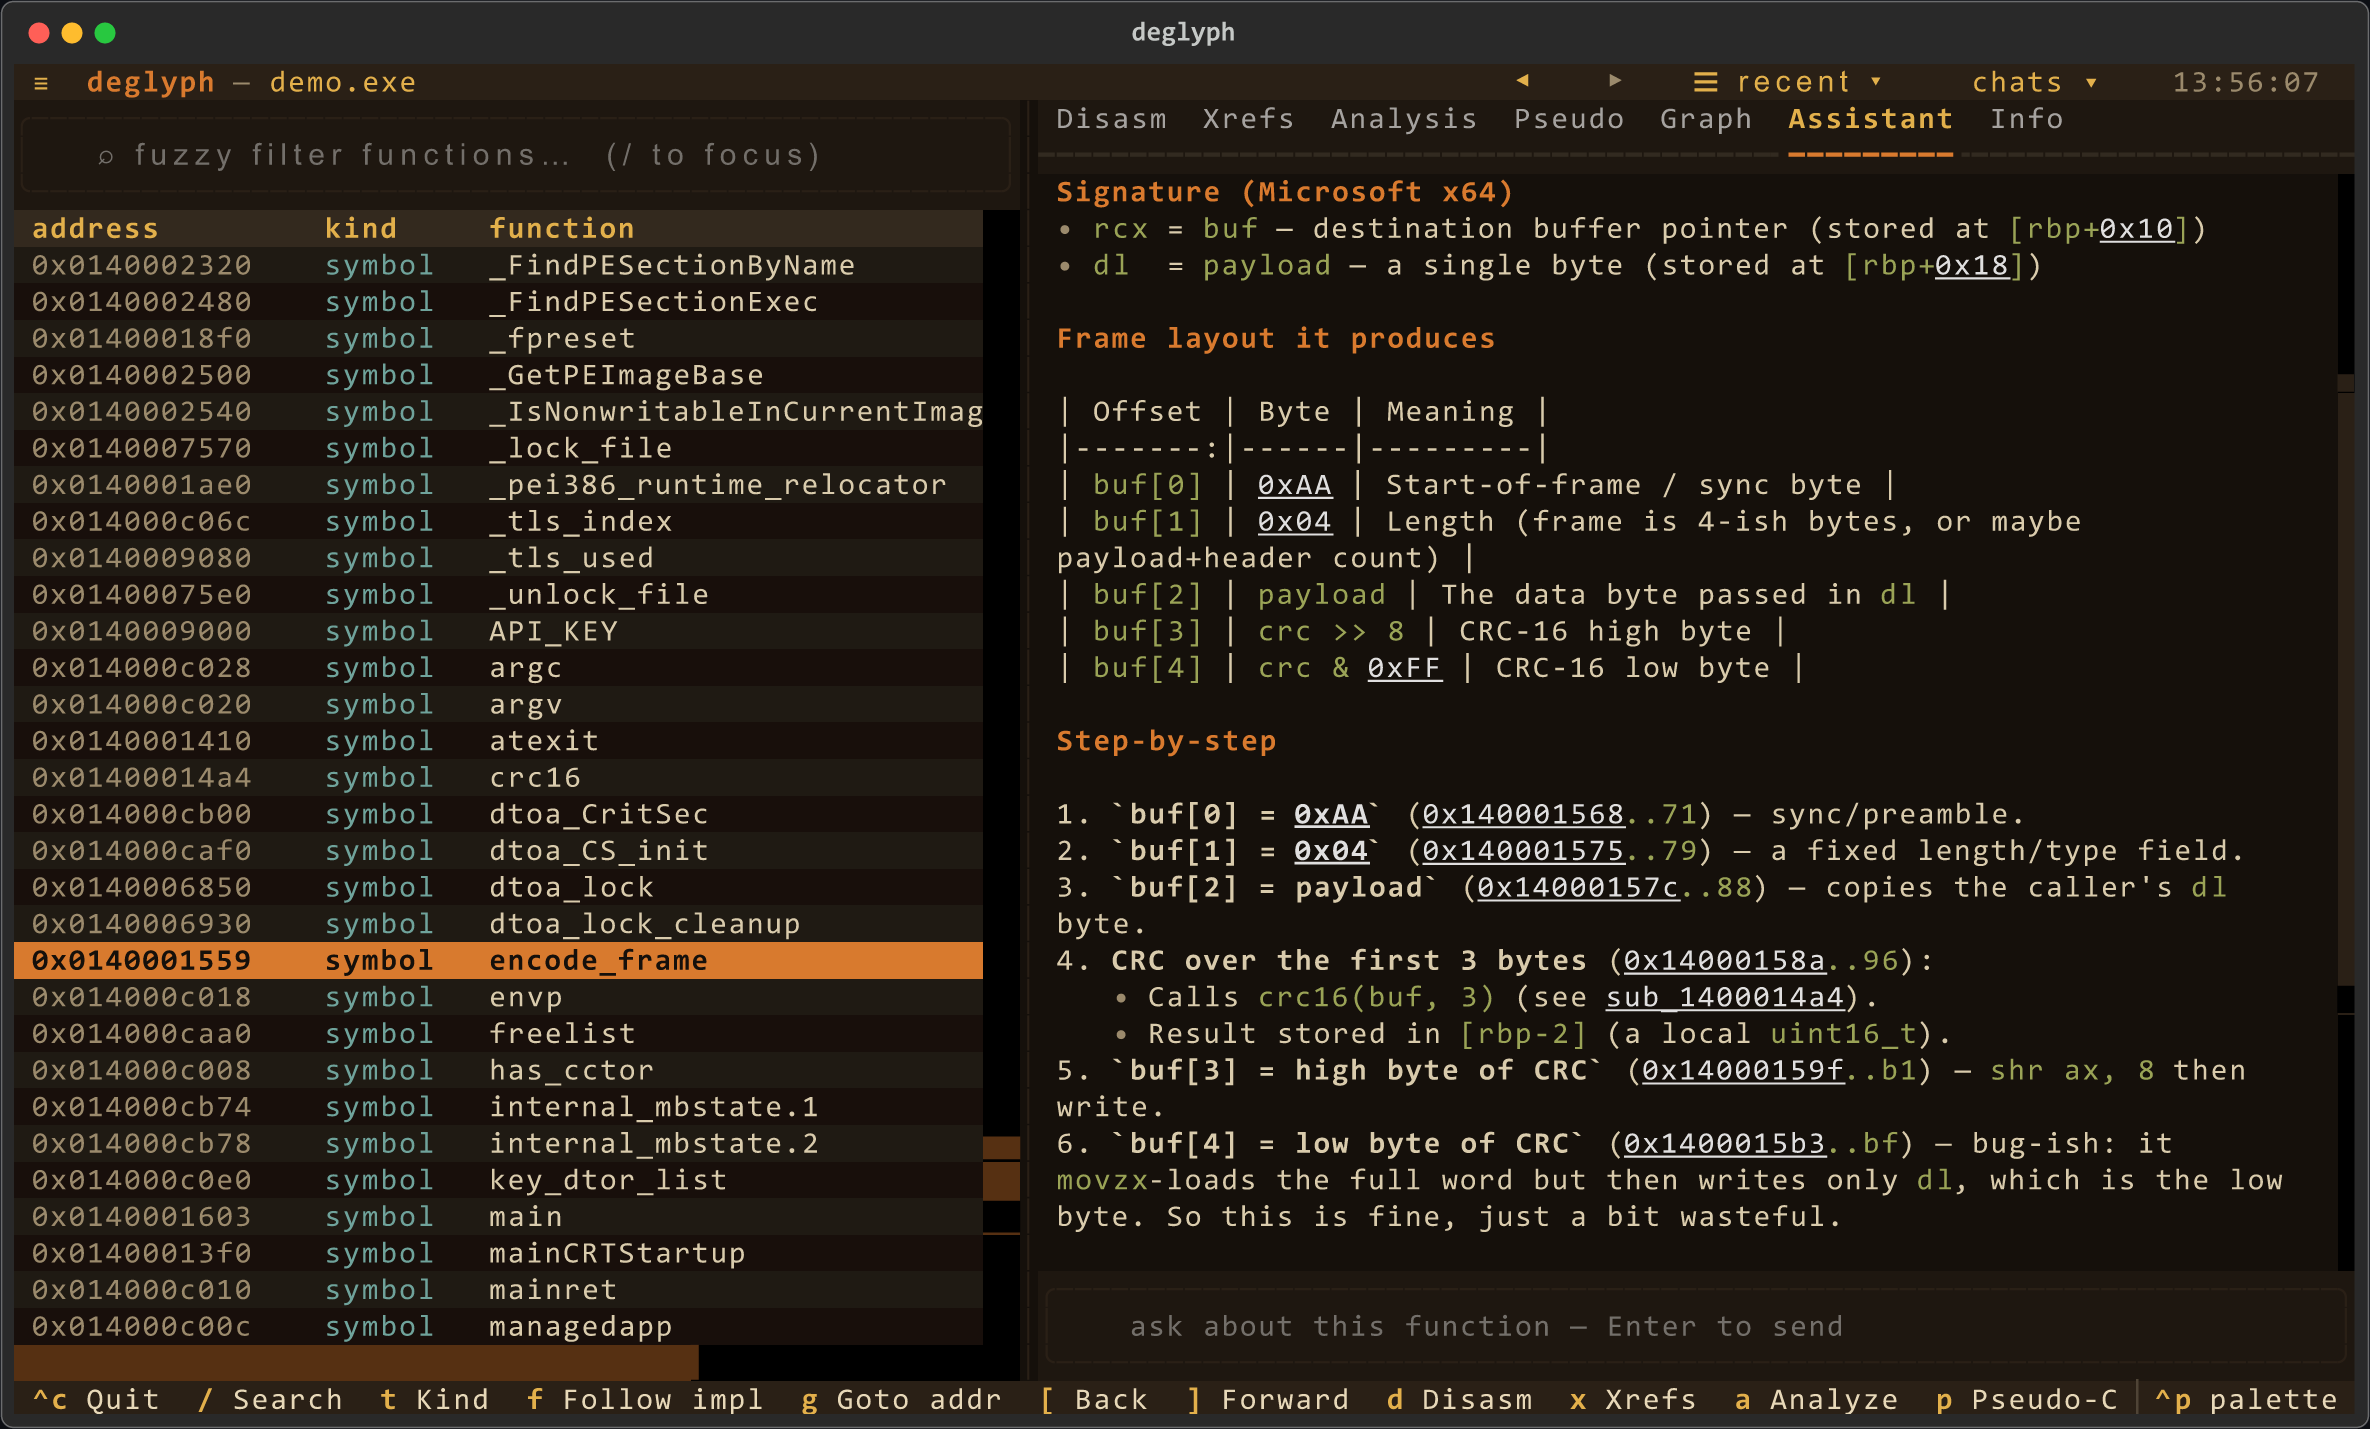
Ask the assistant. With ANTHROPIC_API_KEY set, press i to chat with Claude
about the binary. It is agentic: ask "where does it parse a header / build
the frame / hit the network" and it calls read-only tools (find/disassemble/analyze/
xrefs/search) to locate and explain the function itself, citing clickable addresses.
The current function's disassembly is cached context; tool calls show live as it
works. Replies render as markdown with the cited addresses still clickable, and
each function's conversation is saved with your other annotations, so it resumes
when you re-open the binary. Opt-in, sends nothing until you ask. It ships with
every install; you choose a model and add a key. Use Claude with your own key, or
point it at any OpenAI-compatible endpoint, including a local Ollama or LM Studio.
See Set up the AI assistant for the steps.
Scan for CI (deglyph scan). A headless check for build pipelines: it reports
embedded secrets (private keys, cloud/provider tokens, and credential-labeled
strings), risky imports (process execution, code injection, dynamic loading,
network, anti-debug), and build drift against a --baseline (functions and
imports that appeared or vanished). It also checks the binary's hardening
posture (ASLR/DEP/CFG, PIE/RELRO, stack canaries, fortified calls),
fingerprints linked libraries (zlib,
OpenSSL, SQLite, and more), and can look those up on osv.dev for known CVEs
(--cve). Output is human text, --format markdown for a PR comment,
--format html for a one-file dashboard, --format sarif for GitHub code
scanning, --format json for tooling, or --format badge for a live shields.io
badge; findings set a non-zero exit (--fail-on chooses the gate). Rule levels
and suppressions are configurable via .deglyphrules and .deglyphignore.
See GitHub Actions below for the ready-to-copy workflow.
Produce an SBOM (deglyph sbom). Emit a CycloneDX 1.5 or SPDX 2.3 bill of
materials built from the fingerprinted libraries, with the scanned binary as the
root component and a package URL per detected library:
deglyph sbom path/to/app --format cyclonedx # or spdxExport the analysis (deglyph export). A versioned, deterministic JSON
document of the whole analysis (functions with confidence/evidence, cross-
references, detector hits, strings, scan findings, optionally per-function
control-flow blocks) for feeding another tool or a diff. Move your work
between machines (deglyph project export/import) writes your renames, notes,
bookmarks, and saved view to a path-independent file you can reattach to the
binary elsewhere.
Identify functions (deglyph scan --identify). Match a recovered
sub_<address> against a corpus of function signatures to name it as, for
example, inflate from zlib. The signature is the function's normalized
instruction stream, so it survives a rebuild that moved the code; an exact match
is high confidence, a near match carries a similarity score. The corpus is built
in CI over many well-known libraries and shipped with the tool. See the
Function Database.
Diff two builds (deglyph diff OLD NEW). Match functions across builds by
content, not by name or address: unchanged, modified (with a similarity), added,
or removed. The same signatures power the scan --baseline drift report, which
now reports a recompiled function as modified instead of removed plus added.
Share your naming (deglyph knowledge export/import). Unlike a project file
(keyed by address), a knowledge file keys each rename and note by the function's
content hash, so it reattaches to the same function in a different build or on
another machine.
Attest a scan (deglyph attest). Emit a tamper-evident record of a scan: the
tool version, the binary's hash, and the finding set, under a sha256 digest, with
an optional ed25519 signature (pip install 'deglyph[sign]'). deglyph verify-attest checks the digest and, with the public key, the signature, so a
scan result becomes a verifiable, diffable artifact.
Annotate and keep it. Rename a function (n), add a note (;), or bookmark
it (b). Annotations are keyed by address and saved to a per-user sidecar
(~/.deglyph/annotations/, or $DEGLYPH_STORE_DIR), so they survive across sessions
and work even when the binary lives in a read-only system directory. Renames show
everywhere the function appears: the table, call targets, the graph, and xrefs.
Re-open a binary you have worked on and deglyph asks whether to load that saved
context or start fresh; your work autosaves on quit.
Navigate by history. A toolbar under the header has back/forward arrows over a
browser-style jump stack (every deliberate goto/follow/click, not idle scrolling),
plus a "recent" menu of visited functions and a "chats" menu of functions you have
asked about. [ and ] go back and forward.
Theme it. ctrl-p opens the command palette; "Change theme" switches between
the default deglyph palette and Textual's built-in light and dark themes, and your
choice is remembered for next time. --ascii
(or $DEGLYPH_ASCII) swaps box-drawing and arrow glyphs for ASCII on limited
terminals; --nerd (or $DEGLYPH_NERD) uses Font Awesome icons if your terminal
runs a Nerd Font.
Start anywhere. Launch with no file and deglyph opens a welcome screen: pick up a recent session (any binary you have annotations for) or browse for a file with a small navigator. Launch with a file and that file is offered as "Continue" on the same screen.
The launcher creates an isolated virtual environment on first run and installs everything into it, so the only requirement on the host is Python 3.10 or newer.
./deglyph.sh path/to/library.dll # or just ./deglyph.sh to open the welcome screenFirst launch prints creating virtual environment..., installs the
dependencies, then opens the interface. Later launches start immediately.
You can also install it as a package and use the deglyph command. A plain
install is complete: the AI assistant (anthropic) and C++ symbol demangling
(cxxfilt) are both runtime dependencies.
python3 -m venv .venv
. .venv/bin/activate
pip install -e .
deglyph path/to/library.dllThe assistant ships with deglyph, so there is nothing extra to install. It stays
quiet until you choose a model and give it a way to reach one. Pick whichever of
the two routes below fits you, then open any function and press i to ask in
plain language ("where does this parse the header?", "who calls this?"). The
assistant calls read-only tools to find the answer in the binary and cites the
addresses, which stay clickable in its reply. It sends nothing until you ask.
Use Claude with your own key. Get a key from the Anthropic console and put it in your environment:
export ANTHROPIC_API_KEY=sk-ant-...
deglyph path/to/library.dll      # press i on any function
The default model is claude-opus-4-7; set DEGLYPH_MODEL to use a different one.
Use another provider, or a local model. The assistant also speaks any
OpenAI-compatible endpoint: OpenAI, Azure, Groq, OpenRouter, DeepSeek, and a local
Ollama or LM Studio. Open the command
palette (ctrl-p), choose AI provider, and pick a provider, model, and base URL;
the local providers fill in their own URL, so you only choose a model you have
pulled. Your choice is remembered. The same settings are available as environment
variables for headless or scripted setups:
export DEGLYPH_AI_PROVIDER=openai      # or groq, openrouter, deepseek, ollama, lmstudio
export DEGLYPH_AI_BASE_URL=https://api.openai.com/v1
export DEGLYPH_AI_MODEL=gpt-4o
export DEGLYPH_AI_API_KEY=sk-...       # not needed for a local model
deglyph tells you when a key is missing and what to do about it. Two more
knobs: DEGLYPH_AI_TIMEOUT (seconds per request, default 90) and
DEGLYPH_AI_MAX_ITERS (how many tool steps the assistant may take, default 24).
deglyph BINARY                  # open the interface (format and arch auto-detected)
deglyph notepad.exe             # a bare name is resolved on PATH (and System32 on Windows)
deglyph BINARY --arch arm64     # force the architecture
deglyph BINARY --fmt PE         # force the container format
deglyph BINARY --slice N        # pick a slice of a fat (universal) Mach-O by index
deglyph BINARY --list           # print the function table and exit
deglyph BINARY --analyze NAME   # print constant and CRC analysis for matching functions
deglyph BINARY --strings        # dump extracted strings (ASCII / UTF-8 / UTF-16LE); add --json
deglyph BINARY --list --json    # machine-readable output for scripts and build diffs
deglyph BINARY --no-discover    # skip sub_* discovery of unexported functions
deglyph BINARY --ascii          # ASCII glyphs for limited terminals
deglyph BINARY --nerd           # Font Awesome icons (needs a Nerd Font terminal)
deglyph scan PATH               # CI scan: hardening, secrets, libs, CVEs, imports, drift
deglyph scan PATH --format sarif  # emit a SARIF 2.1.0 report for code scanning
deglyph scan PATH --baseline OLD  # also report what changed since a prior build
deglyph scan PATH --identify    # name recovered functions against the signature corpus
deglyph diff OLD NEW            # semantic function-level diff between two builds
deglyph sbom PATH               # CycloneDX (or --format spdx) bill of materials
deglyph export PATH             # versioned JSON analysis document (--cfg, --identify, --max-funcs)
deglyph project export BINARY -f work.json   # portable renames / notes / bookmarks
deglyph project import BINARY -f work.json   # reattach them on another machine
deglyph knowledge export BINARY -f work.json # renames keyed by function content hash
deglyph attest PATH             # signed, machine-checkable scan attestation
deglyph verify-attest DOC --pub key.pem      # verify an attestation's digest and signature
deglyph login TOKEN             # store a hosted-AI (Pro) token; logout clears it
deglyph --version--list, --analyze, --strings, export, and sbom are headless: they print
to the terminal (or --output FILE) and exit, which is what to use in scripts or
to diff two builds of the same library; add --json to --list/--analyze for
structured output. deglyph scan takes a file or a directory and exits non-zero
when it finds anything at or above --fail-on (default warning).
deglyph scan ships as a composite action, so a release binary is scanned on
every push or pull request. Point path at your built artifact and the action
runs the same checks the CLI does: hardening posture, secrets, library
fingerprinting, optional CVE lookups, risky imports, and baseline drift.
# .github/workflows/binary-scan.yml
name: binary scan

on:
  push:
    branches: [main]
  pull_request:

permissions:
  contents: read
  security-events: write # required to upload SARIF
  pull-requests: write   # required to post the PR comment

jobs:
  deglyph:
    runs-on: ubuntu-latest
    steps:
      - uses: actions/checkout@v4

      # Build your binary here, then point `path` at the artifact.
      # - run: make release

      - name: Scan with deglyph
        uses: deglyph-re/[email protected]
        with:
          path: build/app   # file or directory
          sarif: deglyph.sarif
          comment: "true"    # sticky PR comment with the findings
          fail-on: never     # let code scanning gate; do not fail this step

      - name: Upload SARIF
        if: always()
        uses: github/codeql-action/upload-sarif@v3
        with:
          sarif_file: deglyph.sarif
Inputs mirror the CLI flags: baseline diffs against a prior build, cve queries
osv.dev (needs network), entropy enables the noisy high-entropy rule, and
no-hardening / no-fingerprint skip those detectors. With comment: "true" on
a pull request, the action keeps a single sticky comment in sync instead of
stacking a new one per push. Use fail-on (note / warning / error / never)
to choose whether a finding fails the job; the copy above leaves gating to code
scanning. The same file lives at
examples/deglyph-scan.yml.
Add a static "scanned with deglyph" badge:
[](https://github.com/deglyph-re/cli)For a live badge that tracks your latest scan, deglyph scan --format badge writes a shields.io endpoint JSON your CI can publish and embed. See Badges for the full walkthrough.
| Key | Action |
|---|---|
/ |
Focus the filter (subsequence match) |
esc |
Clear the filter |
j / k / arrows |
Move in the function tree |
d |
Disassembly tab (branch/call targets are clickable) |
x |
Cross-references: wrapper chain, plus recursive caller and callee trees |
a |
Analysis: immediate stores, call arguments, CRC loops, constants |
p |
Pseudo-C: heuristic C-like view of the selection |
c |
Call graph: clickable node navigator centered on the selection |
i |
Assistant: ask Claude about the selected function |
s |
Strings: browse every string in the binary |
t |
Data: the whole-file content map and referenced-data view |
v |
Compare the current build against a second binary |
n |
Rename the selected function (persists) |
b |
Toggle a bookmark on the selection (persists) |
; |
Add a note to the selection (persists) |
y |
Copy the active pane's text |
f |
Follow the selection to its implementation |
g |
Go to an address |
e |
Export an analysis report for the binary |
[ / ] |
Navigate jump history back / forward |
f1 / ? |
About and the key map |
ctrl-p |
Command palette (theme switcher, AI provider, etc.) |
ctrl-c / ctrl-q |
Quit |
deglyph/
  core/      image.py    LIEF -> Image: base, sections, function list
             disasm.py   Capstone wrapper: arch mapping, disassembly, thunk follow
  re/        search.py   byte / string / immediate image search
             strings.py  string extraction and per-function data references
             xref.py     callers, callees, wrapper-to-implementation chain
             patterns.py immediate_stores, call_immediate_args, detect_crc_loops
             pseudo.py   heuristic C-like view of a function
             discover.py recover sub_* functions by scanning call targets
  tui/       app.py      Textual application
             render.py   colorized disassembly and hexdump
             glyphs.py   Unicode / ASCII glyph set
             style.tcss  theme
             fingerprint.py library fingerprinting (zlib / OpenSSL / SQLite / ...)
  ai.py      agentic assistant (bring your own key); read-only tools over Image
  scan.py    headless CI scanner: hardening, secrets, libs, imports, drift, SARIF
  sbom.py    CycloneDX 1.5 / SPDX 2.3 bill of materials
  cve.py     osv.dev lookups with an on-disk cache
  report.py  markdown (PR comment) and single-file HTML scan reports
  export.py  versioned JSON analysis document for other tools
  store.py   per-user annotation sidecar (names, comments, bookmarks, chats)
  cli.py     command-line entry point (interface, headless, scan, sbom, export)
core and re have no dependency on the interface; they are usable as a library
for headless analysis and are what the tests exercise. The full source is open;
there is no closed-source fork.
pip install -e ".[dev]"
pytest
The editable install puts this checkout on the path with its test and lint
tools; pytest then runs against the source tree. The suite also resolves the
checkout when run without the install, so a globally installed deglyph does
not shadow it.
The suite covers the pure analysis logic and loads a binary present on the host to exercise the loader and disassembler. Cases that check specific vendor binaries skip when those files are not on the machine, so the suite passes anywhere.
scripts/verify.py checks the docs and source comments against the project's
tone contract (no marketing copy, no AI-narration voice, no first-person, ASCII
in user-facing docs). Run it before a commit:
python3 scripts/verify.pyGPLv3. See LICENSE. Author: Alex Spataru.
deglyph is free software: you may use, study, share, and modify it under the GNU General Public License v3 (or later). Distributing a modified version means releasing your changes under the same license. There is no closed-source fork.