Using unsupervised machine learning to discover trends and groupings in different cryptocurrencies in order to convince the firm Accountability Accounting to invest in those new currencies.
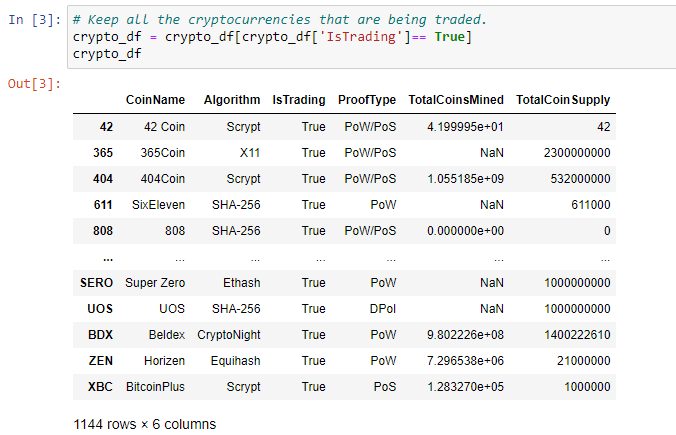
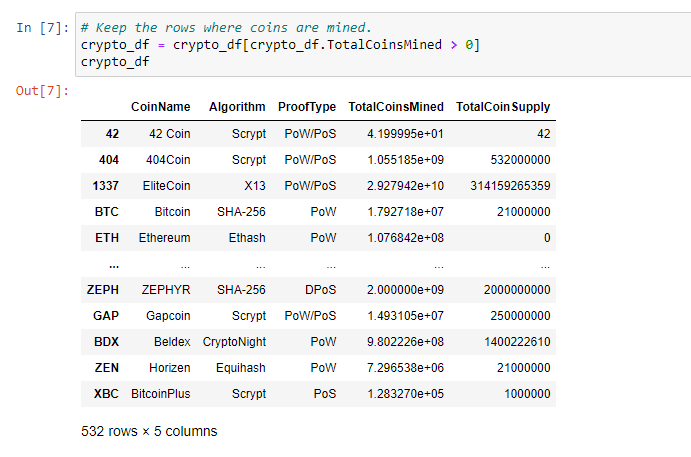
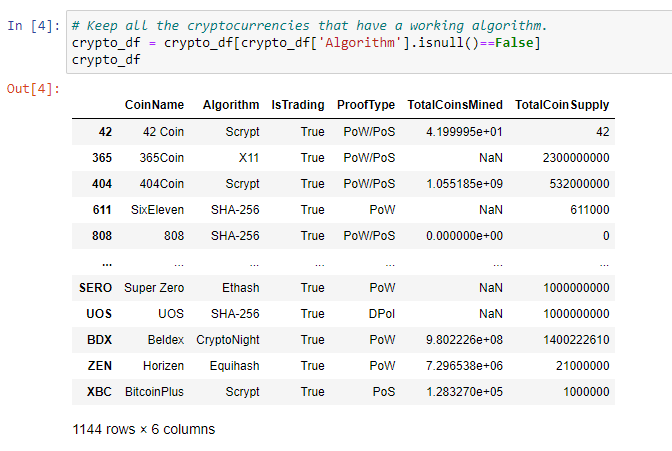
For preprocessing, only those cryptocurrencies that are being traded, having a working algorithm, and having coins mined were kept.
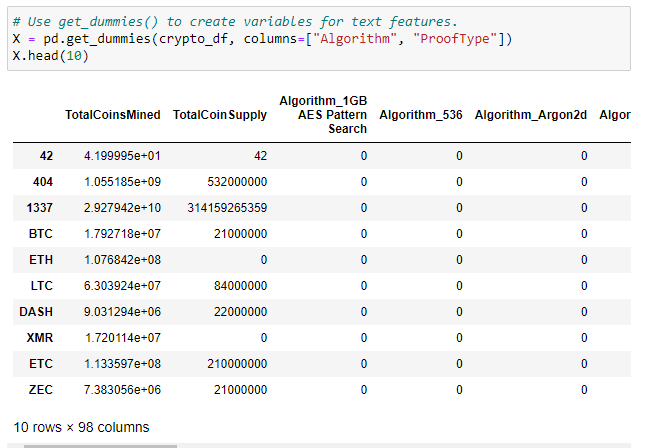
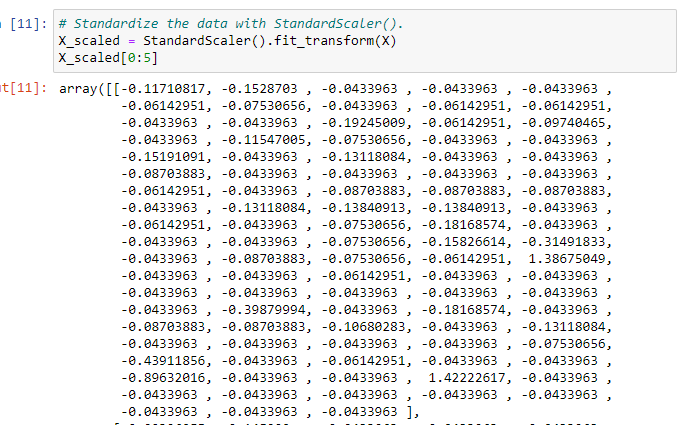
get_dummies() method was used to create variables for the two text features. StandardScaler() was used to standardize the data.
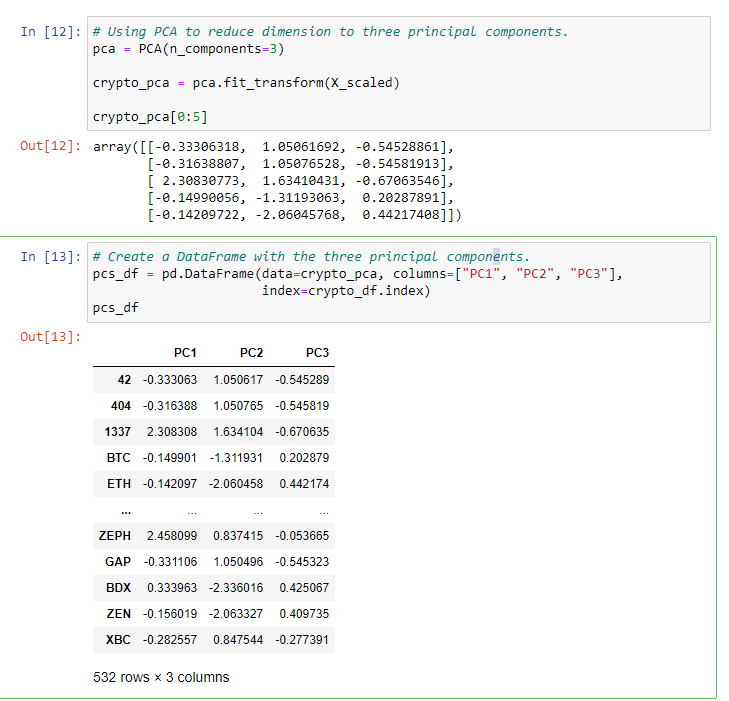
The dimensions of the DataFrame were reduced to three.
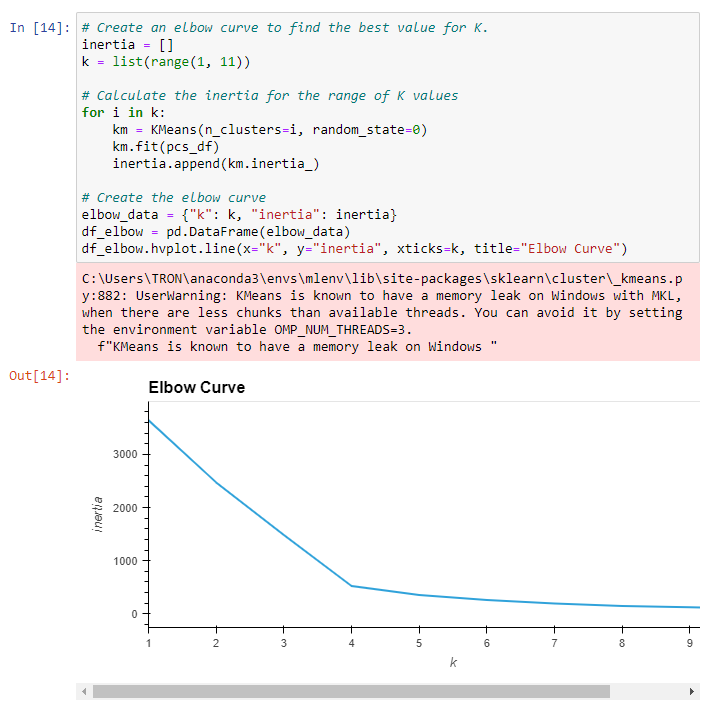
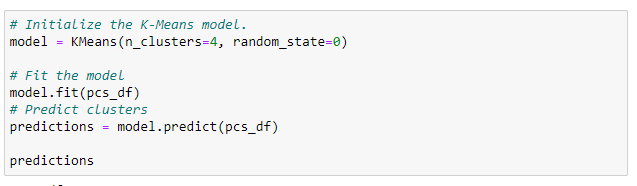
An elbow curve using hvPlot was created and the best value for K is found. K-means algorithm was run to make predictions of the K clusters for the cryptocurrencies' data. The prediction was added to the new DataFrame after concatenation.
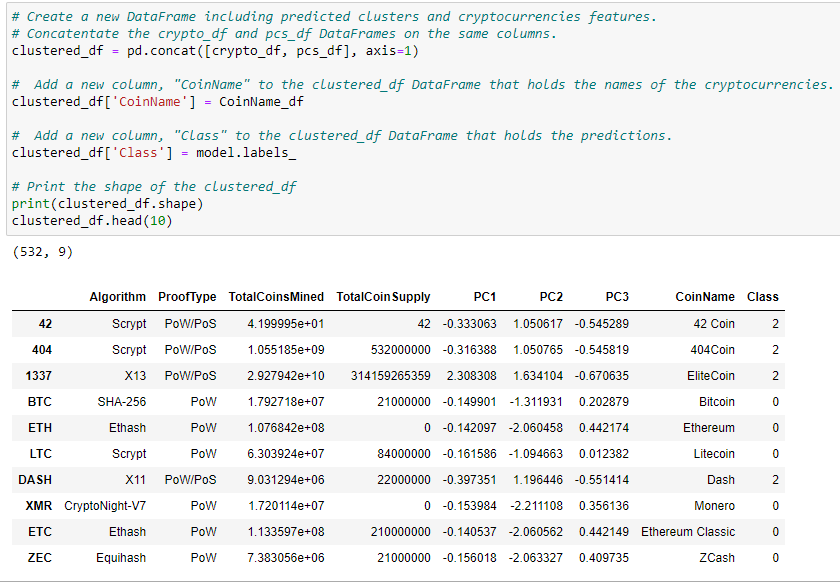
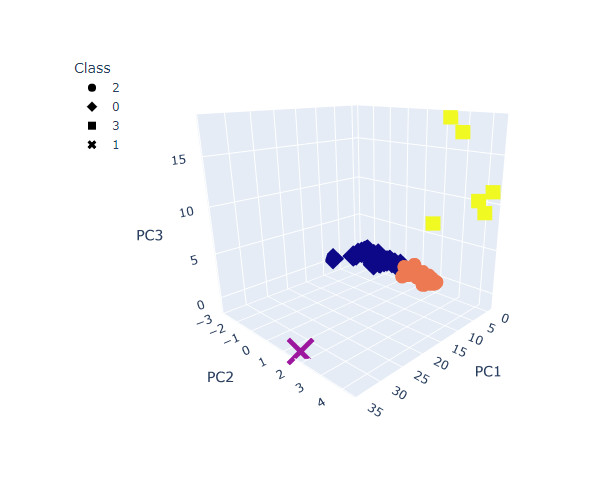
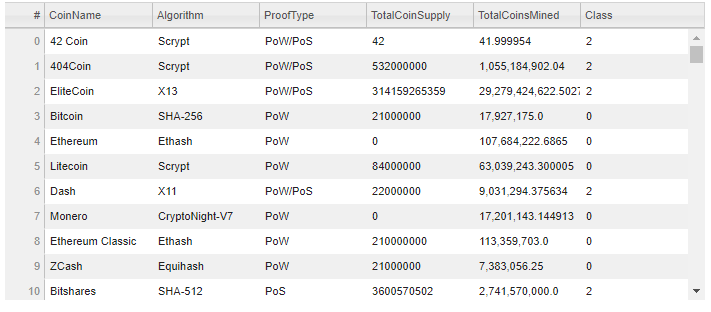
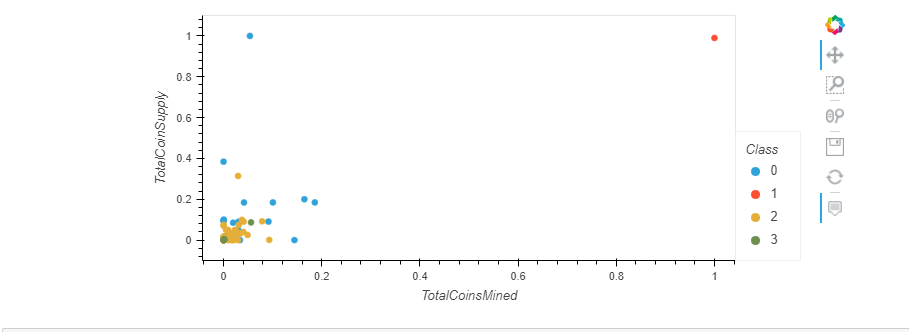
3D scatter plot shows 4 clusters; There are 532 tradable cryptocurrencies. A table with tradable cryptocurrencies was created using hvplot.table(); After scaling the tradable cryptocurrencies using MinMaxScaler(), a scatter plot was created showing 4 clusters with respect to TotalCoinSupply and TotalCoinsMined.