


omni-usage is a terminal-native token consumption dashboard for OmniRoute — the open-source AI gateway. It reads OmniRoute's local call logs from disk and presents your token usage in a live auto-refreshing TUI, a one-shot terminal report, or a teeny single-line peek for your shell prompt.
No API calls, no network, no extra LLM cost. Just your logs, your terminal.
| Feature | Description |
|---|---|
| 🖥️ Live TUI Widget | Auto-refreshing dashboard that fits in 24 lines — no scrolling |
| 📋 One-Shot Reports | Terminal-formatted or JSON output for scripts and pipelines |
| 🔍 Shell-Prompt Peek | Single-line summary for $PS1, tmux status, or Conky |
| 🤖 Per-Model Breakdown | Token volume, request count, and error rate per model |
| 🎯 Route Combo Analysis | See which routing combos consume the most tokens |
| 🔥 Cache Savings Tracking | Prompt cache hit ratio shown in real time |
| 🕒 Session / Today / All Time | Three time windows at once: last 5 min, today, cumulative |
| ⚡ Current Active Model | Bottom bar shows the last-used model/combo |
| 🧩 Zero External Dependencies | Pure Python stdlib — works out of the box |
| 💻 Cross-Platform | macOS, Linux, Windows — any terminal with ANSI support |
pip install omni-usage

# or with uv (fastest):
uv tool install omni-usage

# or from source:
git clone https://github.com/SpinachDigital/omni-usage
cd omni-usage
pip install -e ".[dev]"
Requires Python 3.10+. That's it — the dashboard is built on Python's standard library (plus rich for future display enhancements). No database, no web server, no API keys.
# Launch the dashboard with default 30-second refresh
omni-usage widget

# Custom refresh interval (seconds)
omni-usage widget --interval 60

# Shorthand
omni-usage widget -i 15
Press Ctrl+C to exit.
┌──────────────────────────────────────────────────────────────┐
│  ⚡ omni-usage  ·  v0.1.0  ·  05 Jul 14:32  ·  ref 30s      │
├──────────────────────────────────────────────────────────────┤
│  ⏳ Session (5m)    📅 Today           📊 All Time           │
│  Req 12             Req 112            Req 367               │
│  Tok 1.5M           In  8.7M           ✓  222                │
│                     Out 40K            ✗  145                │
├──────────────────────────────────────────────────────────────┤
│  🤖  Models Used (by token volume)                          │
│  big-pickle                 165        13.1M     ✓           │
│  GPT_5_4                    49         751K      ⚠12         │
│  deepseek-v4_…               2          96K      ✓           │
│  gemini_3_flash              8          75K      ⚠3          │
│  claude-opus-4              11          42K      ✓           │
├──────────────────────────────────────────────────────────────┤
│  🎯  Route Combos (by token volume)                         │
│  auto/best-coding                           5.3M             │
│  auto/claude-opus                           4.7M             │
│  auto/chat                                  3.2M             │
│  auto/code-gen                              1.1M             │
│  auto/deep-research                         890K             │
├──────────────────────────────────────────────────────────────┤
│  Now: auto/best-coding  ·  🔥 89% cache saved  ·  Ctrl+C    │
└──────────────────────────────────────────────────────────────┘
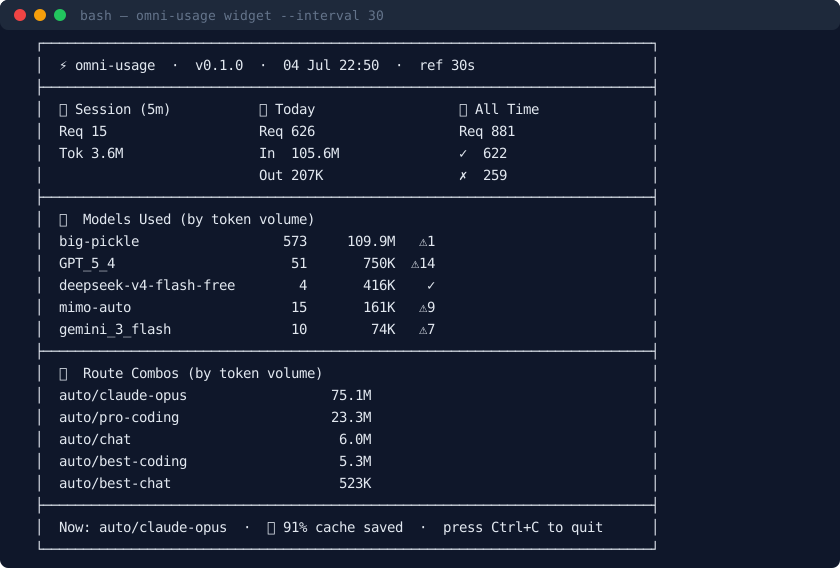
The widget fits in 24 lines on any standard terminal — no scrolling needed. Three stats columns side-by-side, top models and combos ranked by token volume, and a footer showing what model or combo is active right now plus your cache savings rate.
# Terminal-formatted report
omni-usage report

# JSON output (pipe into jq, feed to scripts, log to file)
omni-usage report --json
Example output:
omni-usage report  ·  2026-07-05 14:32:00 UTC
────────────────────────────────────────────────────────
  Requests:      367  ✓   222  ✗   145
  Input:       8.7M
  Output:       40K
  Cache read:  7.8M
  Total:      14.2M

  Model                              Req     Tokens
  ──────────────────────────────────────────────────────
  big-pickle                         165     13.1M
  GPT_5_4                             49      751K
  deepseek-v4_1                        2       96K
  gemini_3_flash                       8       75K
  claude-opus-4                       11       42K
omni-usage peek
# → ⚡ 14.2M total  ·  8.7M today  ·  367 requests
Integrate it anywhere you have a shell:
| Location | How |
|---|---|
| Bash/Zsh prompt | PS1='\u@\h $(omni-usage peek) \$ ' |
| tmux status bar | set -g status-right '#(omni-usage peek)' |
| Conky / desktop widget | ${exec omni-usage peek} |
| Hermes Agent slash command | hermes skill install path/to/omni-usage |
| Column | Window | What it measures |
|---|---|---|
| ⏳ Session | Last 5 minutes | Recent spikes, active model, current throughput |
| 📅 Today | Current UTC day | Daily burn rate, budget tracking |
| 📊 All Time | Entire log history | Cumulative totals, success/error counts |
| Section | Content |
|---|---|
| 🤖 Models | Top 5 models ranked by total tokens (input + output), with request count, token volume, and error indicators |
| 🎯 Combos | Top 5 route combos ranked by input-token volume — shows which routing strategies are costing you |
| 🔥 Footer | Last-used model or combo name, prompt cache savings percentage, refresh interval |
The 🔥 X% cache saved metric in the footer compares tokens.cacheRead against total input tokens. Higher is better — it means OmniRoute's prompt caching is doing its job, saving you money on repeated context.
You run an AI gateway. You know you're spending money on tokens. But the only way to see usage is to log into a cloud dashboard, query an API, or grep through thousands of JSON files. Every extra API call for "just check usage" costs you more tokens.
omni-usage inverts the model. Instead of polling a remote API, it reads the call logs that OmniRoute already writes to disk for every proxied request. This means:
- Zero token overhead — no API calls, no hidden costs
- Offline-first — works without internet
- Sub‑second startup — no network latency, no auth handshake
- Local privacy — your usage data never leaves your machine
| Feature | omni-usage | LangSmith / Weights & Biases | Cloud dashboards |
|---|---|---|---|
| Network required | ❌ No | ✅ Yes | ✅ Yes |
| Extra token cost | ❌ Zero | ✅ Yes (API calls) | ✅ Yes (API calls) |
| Startup time | ~50ms | Seconds+ | Seconds+ |
| Live TUI | ✅ Yes | ❌ Web only | ❌ Web only |
| Shell integration | ✅ peek subcommand |
❌ | ❌ |
| Offline capable | ✅ Yes | ❌ No | ❌ No |
| Zero dependencies | ✅ Python stdlib | ❌ Heavy SDK | ❌ N/A |
| Open source | ✅ MIT | ❌ Proprietary | ❌ Proprietary |
- OmniRoute users who want instant usage visibility
- Solo devs & small teams who don't want to add another SaaS dashboard
- Terminal lovers who live in their shell and want data at a glance
- Budget-conscious teams tracking token spend without paying for monitoring tools
- OmniRoute logs every proxied request as a JSON file to
~/.omniroute/call_logs/<YYYY-MM-DD>/<uuid>.json - Each log contains: model name, provider, combo name, status code, timestamps, and a
tokensobject (in,out,cacheRead,reasoning) omni-usagescans these files, aggregates the counts, and renders them
The aggregation is a single linear pass — O(n) in the number of log files. For 10,000 records it completes in under 50ms.
# Fail a build if today's tokens exceed a threshold
TODAY=$(omni-usage report --json | python -c "import json,sys; d=json.load(sys.stdin)['today']; print(d['in']+d['out'])")
if [ "$TODAY" -gt 10000000 ]; then
  echo "⚠️  Token budget exceeded: $TODAY"
  exit 1
fi# Cron: every day at 9 AM
0 9 * * * omni-usage report >> ~/token-usage.logomni-usage report --json | python -c "
import json, sys
d = json.load(sys.stdin)
for model, stats in d['models']:
print(f'{model},{stats[\"req\"]},{stats[\"in\"]},{stats[\"out\"]},{stats[\"cache\"]}')
"tmux new-session -d 'omni-usage widget -i 10' \; \
split-window -h 'tail -f ~/.omniroute/call_logs/*/*.json'git clone https://github.com/SpinachDigital/omni-usage
cd omni-usage
pip install -e ".[dev]"- Python 3.10+ type hints everywhere (
|union syntax,list[str]etc.) rufffor linting and formatting- Keep the widget dependency-light — stdlib is preferred
- Tested against real OmniRoute call logs
-
omni-usage widgetlaunches without error -
omni-usage report --jsonproduces valid JSON -
omni-usage peekprints a single line - Type hints are complete
See CONTRIBUTING.md for full guidelines.
omni-usage/
├── src/
│   └── omni_usage/
│       ├── __init__.py       # Package entry, re-exports
│       ├── __about__.py      # Version metadata
│       ├── __main__.py       # `python -m omni_usage` support
│       ├── cli.py            # CLI argument parsing, report/peek commands
│       ├── collector.py      # Call log parser + aggregation engine
│       └── widget.py         # Live TUI renderer + refresh loop
├── pyproject.toml            # Hatchling build config + metadata
├── CONTRIBUTING.md
├── LICENSE
└── README.md                 # ← you are here
MIT — see LICENSE.
Built with ❤️ for the OmniRoute community.
⭐ Star the repo if you find it useful — it helps others discover it.