Pace & Push exposes an SVG chart endpoint that can be embedded in a GitHub profile README:
[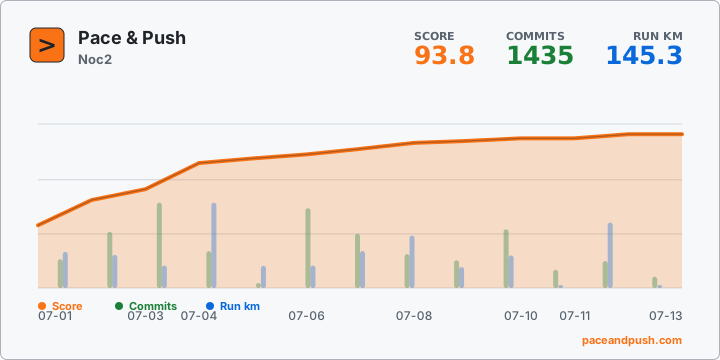](https://paceandpush.com/)Replace Noc2 with any public Pace & Push login. The chart is rendered as SVG
so it works in Markdown image embeds and stays small enough for profile pages.
The surrounding Markdown link makes the image open the Pace & Push homepage
when it is clicked from a GitHub profile README.
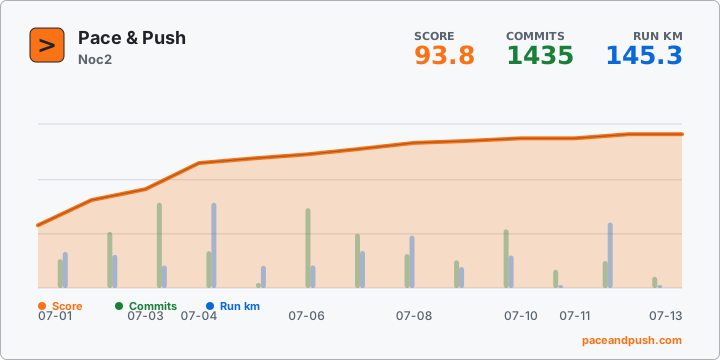
The endpoint supports GitHub-friendly light and dark cards. Add theme=light
for GitHub's light profile surface, or theme=dark for GitHub's dark surface:
[](https://paceandpush.com/)[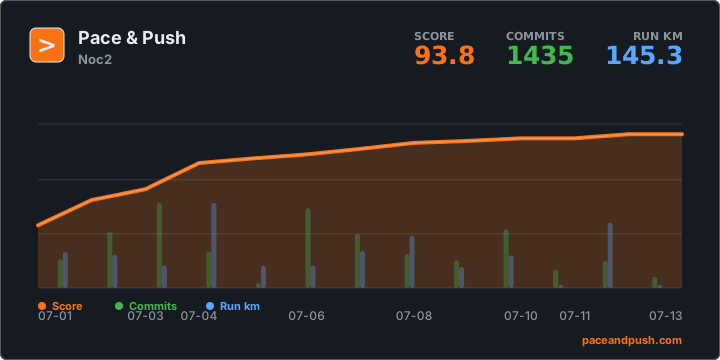](https://paceandpush.com/)The chart includes:
- current period score
- commit total
- kilometer total
- period score trend on a fixed 0-100 axis
- daily commit bars
The score uses fixed published activity plateaus, so another user joining or posting an outlier cannot change the number in an existing README. The public endpoint bypasses shared caches so privacy withdrawal takes effect immediately.